Global Crude Steel Production Trends (2005–2025): Regional Output & World Share Shifts
 By
/ 2026-11-03
Steel is the backbone of global construction, infrastructure, machinery and manufacturing. The last two decades (2005–2025) have witnessed one of the most dramatic reshufflings of the global steel supply map. The balance of crude steel production has moved away from mature Western industrial economies toward fast-growing Asian markets, while new production hubs have emerged across South Asia, the Middle East and Southeast Asia.
All data referenced in this article is sourced from the World Steel Association (worldsteel) crude steel statistical reports, tracking output volume and percentage share of total global production from 2005 to 2025worldsteel.
Overview of Total Global Steel Output
In 2005, total world crude steel production stood at roughly 1,130 million tonnes. By 2025, the global total had climbed to approximately 1,849 million tonnes. The global steel pie expanded by more than 63% within 20 years. However, this growth was not evenly distributed. Some regions expanded rapidly, while traditional steelmaking regions lost their share of the global market.
Regional & Country-by-Country Production & Share Changes
China
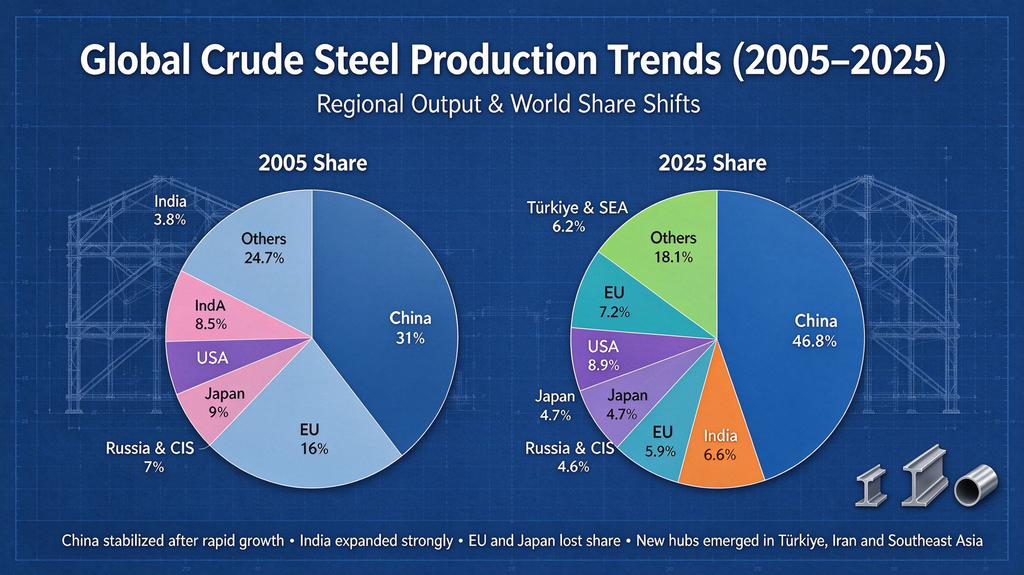
2005: China produced around 350 million tonnes of crude steel, accounting for roughly 31% of global output. Peak period (2014–2020): China’s share surged to over 50%, at one point hitting nearly 54% of world steel production. This explosive expansion was driven by domestic urbanization, infrastructure investment and export manufacturing demand. 2020–2025 trend: China began capacity adjustment, energy consumption control and low-carbon transformation. Annual output gradually stabilised and slightly declined. Its global share moderated to about 46.8% in 2025, but it remains the world’s dominant steel producer by a large marginworldsteel.
Key takeaway: China transformed from a major producer into the global steel supply centre, then entered a phase of high-quality, controlled-capacity development.
India
India is the fastest-growing major steel producer in this 20-year window. 2005: India’s crude steel output was only about 40 million tonnes, less than 4% of global production. 2025: India reached 164.9 million tonnes, capturing roughly 6.6% of global output, and firmly held the No.2 position worldwide. Driven by national infrastructure plans, housing construction and domestic manufacturing expansion, India’s steel output has maintained steady year-on-year growth, while many other countries shrank. It is widely forecast to keep lifting its global share in the next decadeworldsteel.
European Union (EU27)
The EU was once a core global steel pillar. 2005: EU27 accounted for around 16% of world crude steel production. 2025: Its share dropped to roughly 7.2%. Total output has declined continuously, pressured by high energy costs, decarbonisation rules, industrial relocation and import competition. Many older blast furnaces have been shut down over the two decades, and the EU has become a net steel importer for many grades of structural steelworldsteel.
United States
US steel production remained relatively stable in absolute tonnage but lost global share. 2005: About 8.5% of global steel output. 2025: Around 5.9% of global output. US mills focus heavily on high-value flat steel, while long products such as I beams, H beams and channel steel rely increasingly on imports. Production fluctuates closely with domestic construction, automotive and oil & gas cycles.
Japan
Japan’s steel output has slowly contracted. 2005: Nearly 9% of global crude steel. 2025: Approximately 4.7%. Japan retains high-quality specialty steel and structural steel capacity, but slow domestic demand and limited capacity expansion prevent volume growth.
Russia & CIS Region
Russia and other CIS countries used to be a stable steel export bloc. 2005: Combined share near 7%. 2025: Around 4.6%. Geopolitical shifts, logistics restrictions and reduced export market access have pushed its output and global share lower after 2022.
South Korea
South Korea maintained steady production for many years, anchored by POSCO and downstream shipbuilding & automotive industries. Its global share slipped gradually from about 4% in 2005 to roughly 3.3% in 2025.
Emerging hubs: Türkiye, Iran, Vietnam, Indonesia
This group is one of the biggest stories of the past 20 years:
- Türkiye: Grew into a major long steel producer, competitive in I beam, channel and angle steel export markets.
- Iran: Expanded steel capacity for domestic infrastructure and regional Middle East trade.
- Vietnam & Indonesia: Fast-growing Southeast Asian steel capacity, fuelled by local construction and manufacturing relocation.
These emerging markets collectively lifted the Middle East and Southeast Asia’s combined global share from below 3% in 2005 to over 6% by 2025worldsteel.
Summary Table of Share Shift (Simplified)
| Region / Country | Approx. 2005 Global Share | Approx. 2025 Global Share | Main Trend |
|---|---|---|---|
| China | ~31% | ~46.8% | Sharp rise, then stabilisation |
| India | ~3.8% | ~6.6% | Continuous strong growth |
| EU27 | ~16% | ~7.2% | Clear decline |
| USA | ~8.5% | ~5.9% | Slow decline |
| Japan | ~9% | ~4.7% | Gradual shrinkage |
| Russia & CIS | ~7% | ~4.6% | Downward trend after 2022 |
| Türkiye, Iran, SEA | ~3% | ~6.2% | Fast rising emerging producers |
What This Means for Steel Buyers & Structural Steel Sourcing
This long-term shift has practical implications for buyers sourcing IPE I beams, HEA/HEB H beams, UPN channels, angle steel and steel pipes:
- Supply diversity: 20 years ago, buyers mainly relied on EU, Japan and South Korea. Today, China, India, Türkiye and Middle Eastern mills are major suppliers.
- Cost & lead time differences: Each region has distinct raw material costs, energy prices, export policies and MTC certification standards.
- Risk dispersion: Supply concentration in China peaked; new alternative sources are gaining capacity, reshaping global steel pricing cycles.
- Decarbonisation impact: EU carbon border rules, China’s low-carbon policy and India’s capacity roadmap will continue to change regional competitiveness in the next 10 years.
Our Perspective
Shandong Xinqiao Industrial Co., Ltd. tracks global steel output trends closely to help our customers secure stable structural steel supplies, including I beams, H beams, channel steel and angle steel. We source from verified mills with complete MTC certificates, offer export packing, custom cutting and flexible trade terms including FOB, CFR and CIF.
Whether you are a construction contractor, fabricator or steel trader, understanding global production share changes helps you forecast price trends and choose reliable supply sources.
If you need stock information, quotation or mill document support for structural steel profiles, contact our team.
📩 Email: admin@trustbridgetj.com
FAQ
Q: What is crude steel?
A: Crude steel is the primary molten steel output before rolling into finished profiles such as I beams and H beams. It is the standard benchmark used by the World Steel Association for cross-country comparison.
Q: Will India overtake China in steel production?
A: India’s growth rate is much higher, but the absolute output gap remains very large. Most forecasts expect India to keep expanding, yet it will take many years to close the volume gap.
Q: Why is EU steel share falling?
A: High energy costs, strict carbon regulations, deindustrialisation and competitive imports are the core drivers.
Q: Does this trend affect steel beam prices?
A: Yes. Regional capacity changes, export restrictions and raw material availability directly influence global pricing cycles for IPE, HEB, UPN and other structural profiles.